Here is a question most product teams cannot answer clearly: “How do you know your product strategy is working?”
The most common answers are: “We’re growing.” “Our user numbers are up.” “We shipped a lot this quarter.” These are not answers to the question. They are descriptions of activity. Activity is not strategy. Growth is not success. Shipping is not progress.
The uncomfortable truth is that most product teams are measuring the wrong things, and measuring the wrong things is worse than measuring nothing, because it creates false confidence. You can grow your user base while your strategic position weakens. You can ship features while your core value proposition erodes. You can hit your quarterly targets while your product drifts further from its vision.
Strategic metrics — the kind that actually tell you whether your product strategy is working — are different in kind from the metrics most teams track. They are harder to define, harder to move, and harder to game. They are also the only metrics worth caring about.
This article is about how to define them, track them, and use them to make better strategic decisions.
Metrics vs. KPIs: A Distinction That Matters
Before defining what to measure, it is worth being precise about language, because the confusion between metrics and KPIs is itself a source of strategic drift.
A metric is any measurement. User count, page views, revenue, churn rate, feature adoption — these are all metrics. They describe what is happening in your product. A metric becomes a KPI (Key Performance Indicator) when it is designated as critical to your strategy. Not all metrics are KPIs, but all KPIs are metrics.
The distinction matters because most teams track too many metrics and too few KPIs. They have dashboards full of numbers that describe activity without revealing whether the strategy is working. The goal is not to have fewer metrics, because data is valuable. The goal is to have a small number of KPIs that are directly connected to your strategic vision, and to treat those KPIs with the seriousness they deserve.
A useful rule of thumb: if a metric does not change your decision-making when it moves, it is not a KPI. KPIs are the numbers that, when they move in the wrong direction, require a strategic response.
The Vanity Metric Problem

Vanity metrics are measurements that look impressive but do not measure strategic progress. They are seductive because they tend to go up and to the right, they are easy to communicate, and they generate positive reactions in board meetings and all-hands presentations.
Total registered users is the canonical vanity metric. A large user base feels like evidence of product-market fit, but it is not. Users who registered once and never returned are not evidence of strategic success but evidence of acquisition. What matters is not how many people tried your product, but how many people found it valuable enough to keep using it.
Page views and downloads suffer from the same problem. They measure the top of the funnel without revealing whether the product is delivering value. A product with ten million downloads and a 2% retention rate is not a successful product but a leaky bucket.
Features shipped is perhaps the most insidious vanity metric because it masquerades as productivity. Shipping features is not the goal. Solving problems is the goal. A team that ships twenty features in a quarter and moves none of its strategic metrics has been busy, not productive.
The alternative to vanity metrics is not fewer metrics, but better metrics. Specifically, it is vision-aligned metrics: measurements that are derived from your strategic vision and that prove, when they move in the right direction, that you are making progress toward the future state you are trying to create.
A Framework for Defining Strategic KPIs
The right way to define strategic KPIs is to work backwards from your vision, not forwards from your data. Here is a four-step framework.
Step 1: Start with your vision. What is the future state you are trying to create? What problem are you solving, for whom, and what will the world look like when you have solved it? Your vision is the source of your KPIs. If you cannot articulate your vision clearly, your KPIs will be arbitrary.
Step 2: Define what success looks like. Given your vision, what would you need to see to know that you are moving in the right direction? What would prove that your product is delivering on its promise? These are your candidate KPIs. They should be outcome-based, not output-based, so you should be measuring what changes for the customer, not what you built.
Step 3: Pair leading and lagging indicators. Lagging indicators (revenue, churn, market share) tell you whether you succeeded. They are accurate but slow: by the time they move, it is often too late to course-correct. Leading indicators (feature adoption, engagement depth, time to value) predict future performance. They are faster-moving and more actionable. Amplitude’s research on product analytics consistently shows that teams with a clear North Star metric (a single leading indicator that predicts long-term retention) make better strategic decisions than teams without one.
Step 4: Limit to 3–5 strategic KPIs. More than five and you lose focus. The discipline of choosing your most important metrics forces clarity about what your strategy actually is. If you cannot choose five metrics that capture strategic success, your strategy is not clear enough.
| Metric Type | Example | What It Measures | When to Use |
|---|---|---|---|
| North Star | Weekly active teams (Slack) | Core value delivery | Always — one per product |
| Leading indicator | Feature adoption rate | Predicts future retention | Weekly review |
| Lagging indicator | Annual revenue retention | Confirms strategic success | Monthly/quarterly review |
| Health metric | System uptime, NPS | Prevents strategic blind spots | Ongoing monitoring |
Case Study: How Stripe Measures Strategic Success
Stripe is one of the most instructive examples of strategic measurement done well, not because they publish their metrics framework publicly, but because their product decisions reveal a coherent measurement philosophy.
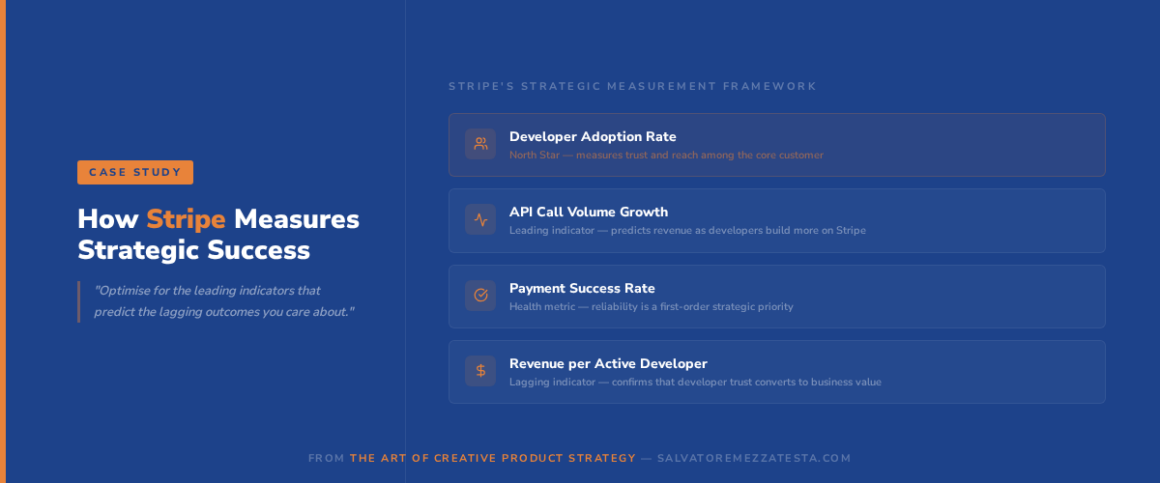
Stripe’s stated mission is to increase the GDP of the internet: to make it easier for businesses of all sizes to accept payments and build financial infrastructure. That mission implies a specific set of strategic questions: Are more developers choosing Stripe? Are they building more with it? Are the businesses they build succeeding?
Those questions translate into a measurement framework that prioritises developer adoption, API usage depth, and the success of businesses built on Stripe’s infrastructure. Revenue is a lagging indicator of that framework: it rises when developers choose Stripe, use it deeply, and build successful businesses on top of it. Stripe does not optimise for revenue directly; they optimise for the conditions that produce revenue.
This is the key insight of strategic measurement: optimise for the leading indicators that predict the lagging outcomes you care about. As Stripe’s engineering blog has documented, their internal culture treats reliability and developer experience as first-order strategic priorities, not because they are nice to have, but because they are the leading indicators of the metric that matters most: developer trust.
The lesson for product teams is not to copy Stripe’s metrics, because your vision is different, so your metrics should be different. The lesson is to apply the same logic: define the leading indicators that predict your strategic outcomes, optimise for those, and let the lagging indicators confirm your progress.
Building Feedback Loops for Continuous Improvement
Defining the right metrics is necessary but not sufficient. The value of strategic metrics comes from the feedback loops they enable: the regular, structured process of reviewing what the metrics are telling you and adjusting your strategy accordingly.
A well-designed feedback loop has three components. First, a regular cadence: strategic KPIs should be reviewed monthly at minimum, with quarterly deep-dives that connect metric performance to strategic decisions. Weekly reviews are appropriate for operational metrics and leading indicators; they are too frequent for strategic KPIs, which move slowly and require trend analysis rather than point-in-time comparison.
Second, a clear decision protocol: every KPI review should answer the question “what does this tell us about our strategy?” If a KPI is moving in the wrong direction, the response is not to change the target, but to investigate whether the strategy is wrong, the execution is wrong, or the metric is wrong. Changing the target to make the number look better is the most common and most damaging response to underperforming metrics.
Third, a connection to roadmap metrics: strategic KPIs should directly inform roadmap prioritisation. If your retention metric is declining, that should surface retention-related work in your roadmap. If your feature adoption metric is stalling, that should prompt an investigation into whether the feature is solving the right problem. The feedback loop between metrics and roadmap is what makes data-driven thinking operational rather than aspirational.
Tools for Tracking Strategic Metrics
The right tool depends on your stage and the complexity of your measurement needs. Here is a practical overview.
Amplitude is the most widely used product analytics platform for teams that need to understand user behaviour at depth. Its North Star framework, which guides teams through the process of defining a single leading indicator that predicts long-term retention, is one of the most practical implementations of strategic measurement available.
Mixpanel offers similar capabilities with a stronger emphasis on funnel analysis and cohort comparison. Both are appropriate for product teams at Series A and beyond.
For earlier-stage teams, Google Analytics 4 combined with a simple spreadsheet-based KPI dashboard is often sufficient. The discipline of defining and tracking five strategic KPIs matters more than the sophistication of the tool.
Productboard integrates metric tracking with roadmap management, making it easier to maintain the connection between strategic performance and prioritisation decisions.
Whatever tool you use, the principle is the same: measure outcomes, not outputs. Track the metrics that tell you whether your strategy is working, not the metrics that tell you whether your team is busy.
If you want to explore the measurement module in depth, that is exactly what The Art of Creative Product Strategy covers.
Key Takeaways
- Activity is not strategy. Growth is not success. Measuring the wrong things creates false confidence and masks strategic drift.
- Not all metrics are KPIs. A KPI is a metric that is critical to your strategy — one that, when it moves in the wrong direction, requires a strategic response.
- Vanity metrics look good but mislead strategy. Total users, page views, and features shipped are outputs. Retention, revenue per user, and feature adoption are outcomes.
- Define strategic KPIs by working backwards from your vision. Pair one leading indicator with one lagging indicator for each strategic goal, and limit yourself to 3–5 KPIs total.
- The value of metrics comes from the feedback loops they enable. Regular, structured reviews that connect metric performance to strategic decisions are what make measurement actionable.
Ready to Go Deeper?
Defining the right metrics is one of the most consequential decisions a product team makes. It shapes what the team optimises for, what gets prioritised in the roadmap, and what gets communicated to leadership and investors.
Get The Art of Creative Product Strategy on Amazon →
The book covers the complete measurement framework, from defining your North Star metric to building feedback loops that connect strategic performance to roadmap decisions.
Want to start with the fundamentals?
Download Module 1 free and build the strategic foundation that makes measurement meaningful.
Frequently Asked Questions About Product Metrics and KPIs
Q1: What is the difference between a metric and a KPI?
A metric is any measurement — user count, page views, revenue, churn rate. A KPI (Key Performance Indicator) is a metric that has been designated as critical to your strategy. Not all metrics are KPIs, but all KPIs are metrics. The distinction matters because most teams track too many metrics and too few KPIs. The goal is to identify the small number of measurements that directly tell you whether your strategy is working.
Q2: How many KPIs should we track?
Three to five strategic KPIs is the right range for most product teams. More than five and you lose focus — you end up with a dashboard full of numbers that no one takes responsibility for. Each KPI should directly measure progress toward your vision. If you cannot limit yourself to five, your strategy is not clear enough to be actionable.
Q3: What is a vanity metric?
A vanity metric is a measurement that looks impressive but does not measure strategic progress. Total registered users, page views, downloads, and features shipped are the most common examples. They tend to go up and to the right, which feels like success — but they do not tell you whether your product is delivering value or whether your strategic position is strengthening. Vanity metrics feel good but mislead strategy.
Q4: How do we choose the right KPIs?
Start with your vision. What would success look like if you achieved it? What would prove that you are moving toward the future state you are trying to create? Work backwards from those questions to identify candidate metrics. Then filter for outcome-based measurements (what changes for the customer) rather than output-based measurements (what you built). The right KPIs are the ones that change your decision-making when they move.
Q5: Should we measure leading or lagging indicators?
Both, and in combination. Lagging indicators (revenue, churn, market share) tell you whether you succeeded — they are accurate but slow. Leading indicators (feature adoption, engagement depth, time to value) predict future performance — they are faster-moving and more actionable. Pair one leading indicator with one lagging indicator for each strategic goal so you have both early warning signals and confirmation of outcomes.
Q6: How often should we review KPIs?
Weekly for operational metrics and leading indicators; monthly for strategic KPIs; quarterly for deep-dives that connect metric performance to strategic decisions. Do not obsess over daily fluctuations in strategic metrics — they move slowly and require trend analysis. The question to ask at every review is not “did the number go up?” but “what does this tell us about our strategy?”
Q7: What if our KPIs are not moving?
That is valuable information, not a problem to be solved by changing the targets. Investigate: is your strategy wrong? Is your execution wrong? Are you measuring the right things? Flat or declining KPIs are a signal to revisit your assumptions, not to adjust the dashboard to make the numbers look better. The teams that improve fastest are the ones that treat underperforming metrics as learning opportunities.
Q8: Should we share KPIs with the entire organisation?
Yes. Transparency builds alignment. When everyone knows the strategic KPIs and understands how their work contributes to them, strategy becomes actionable rather than abstract. The best product organisations make their strategic KPIs visible to every team — not as a performance management tool, but as a shared language for prioritisation and decision-making.
Q9: Can we have different KPIs for different teams?
Yes, but they should all ladder up to the same strategic KPIs. Marketing might track customer acquisition cost; product might track retention; engineering might track system reliability. Each team’s metrics should be derivable from the company’s strategic KPIs — so that when every team hits its metrics, the company hits its strategic goals. Misaligned team metrics are one of the most common causes of strategic drift.
Q10: How do we avoid gaming metrics?
Define metrics that are hard to game by measuring outcomes rather than outputs. Retention is harder to game than features shipped. Revenue per user is harder to game than total users. Tie recognition and prioritisation to strategic outcomes, not metric targets. And build a culture where flat or declining metrics are treated as information rather than failure — because the teams that hide bad metrics are the ones that never improve.